💹📈 Crypto Predictor - AI-Based Cryptocurrency Trading Strategy
This project leverages machine learning to develop a strategy for cryptocurrency trading. The core objective is to create a model that predicts whether the price of a cryptocurrency will increase, decrease, or remain stable in the next market moment (next days). This is achieved by collecting historical price data and applying machine learning techniques to make predictions based on these trends.
Some technical analysis and market statistics were used to forecast cryptocurrency price changes. It built a dataset from historical cryptocurrency data and employed various classification methods to predict future price movements. The application, Crypto Predictor, is a web-based tool designed to aid users in trading by providing trend predictions for selected cryptocurrencies.
This project was originally developed for the course ‘Data Mining & Machine Learning’ in MSc in Artificial Intelligence & Data Engineering at University of Pisa.
📊 Dataset Creation
The dataset was created by scraping historical cryptocurrency values from Yahoo Finance for Bitcoin, Ethereum, and Binance between 2020 and 2022. The Moving Average Cross Strategy, a common financial approach, was employed to generate features for the model.
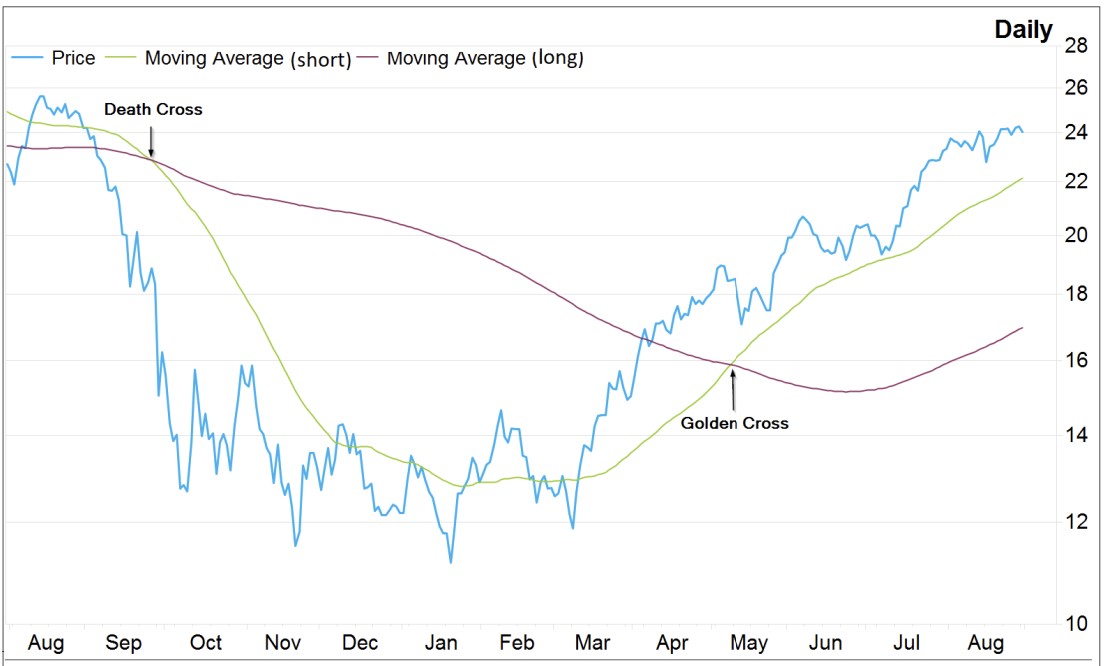
This includes the concept of the Golden Cross, where a short-term moving average crosses above a long-term moving average, indicating a potential rise in the price trend:
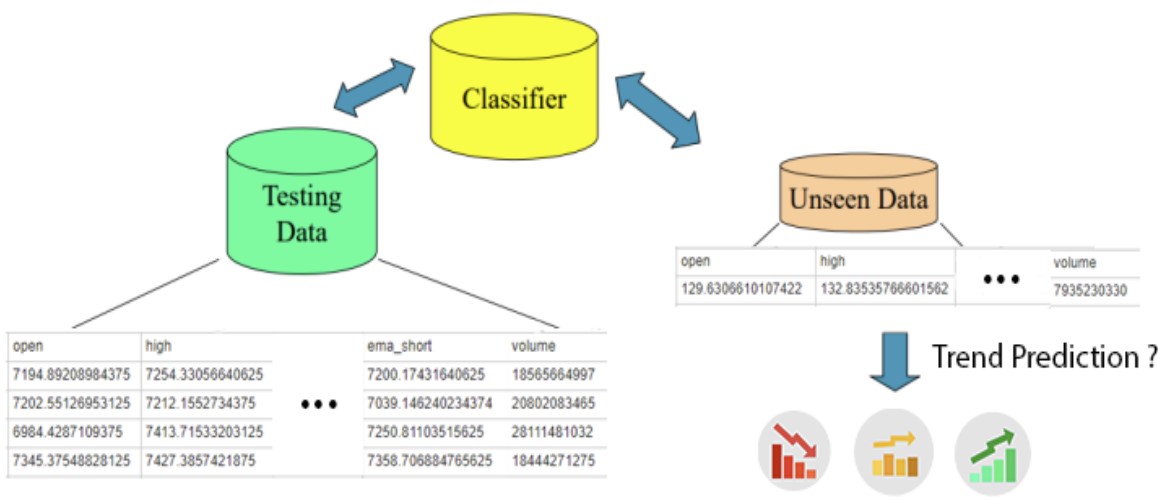
The dataset includes key financial attributes such as open, high, low, close, and adjusted close prices, along with short-term and long-term exponential moving averages (EMAs).
🏗️ Implementation Steps
The project involved several steps:
- Feature Generation
- New attributes, such as short-term and long-term EMAs, were generated.
- Feature Selection
- Attributes strongly correlated with the output classes were selected using a supervised heuristic approach based on mutual information.
- Data Normalization
- Standardization of features was performed using z-score normalization to ensure that all features have a mean of 0 and variance of 1.
- Feature Transformation
- Principal Component Analysis (PCA) was applied to reduce the dimensionality of the dataset while retaining most of the variation in the data.
🏛️ Architecture
Here is the architecture that was used: 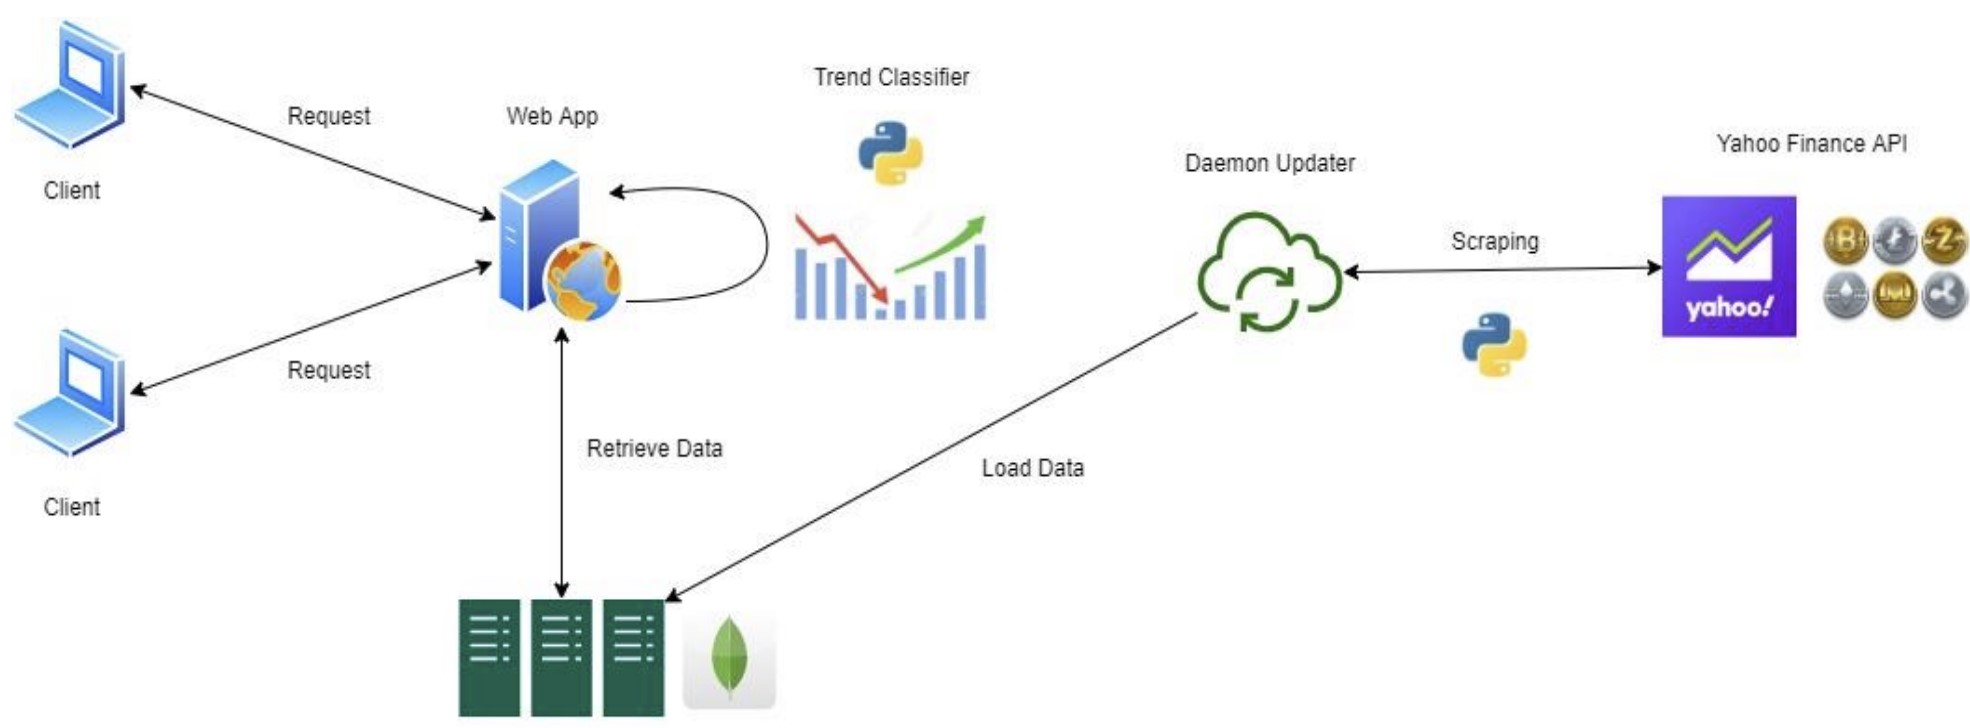
🔍 Classification Models
Various classifiers were tested, including:
- K-Nearest Neighbors
- Logistic Regression
- Gaussian Naïve Bayes
- AdaBoost
- Random Forest
The goal was to achieve high accuracy and F-measure scores, with an accuracy target of at least 70%. After extensive testing, the Random Forest classifier was selected as the best model due to its robust performance across different datasets.
📉 Model Evaluation and Selection
| Currency | Selected Model | Class | Precision | Recall | F1-score | Support | Accuracy |
|---|---|---|---|---|---|---|---|
| BTC | Random Forest | -1.0 | 0.73 | 0.54 | 0.62 | 61 | 0.722 |
| 0.0 | 0.67 | 0.77 | 0.71 | 98 | |||
| 1.0 | 0.81 | 0.84 | 0.82 | 61 | |||
| ETH | Random Forest | -1.0 | 0.83 | 0.74 | 0.78 | 65 | 0.618 |
| 0.0 | 0.52 | 0.15 | 0.23 | 73 | |||
| 1.0 | 0.55 | 0.94 | 0.69 | 82 | |||
| BNB | Random Forest | -1.0 | 0.74 | 0.58 | 0.65 | 59 | 0.641 |
| 0.0 | 0.59 | 0.43 | 0.50 | 84 | |||
| 1.0 | 0.63 | 0.92 | 0.75 | 77 |
Time Series Split Cross-Validation was used to evaluate the models, ensuring that temporal dependencies in the data were preserved. The Random Forest classifier demonstrated the best performance, showing resilience against trend drifts and achieving consistent accuracy and F1-score results across different temporal folds.
🔗 GitHub Repository
Visit the project repository here for project documentation and access to the codebase and project documentation.
(if you enjoyed this content, please consider leaving a star ⭐).
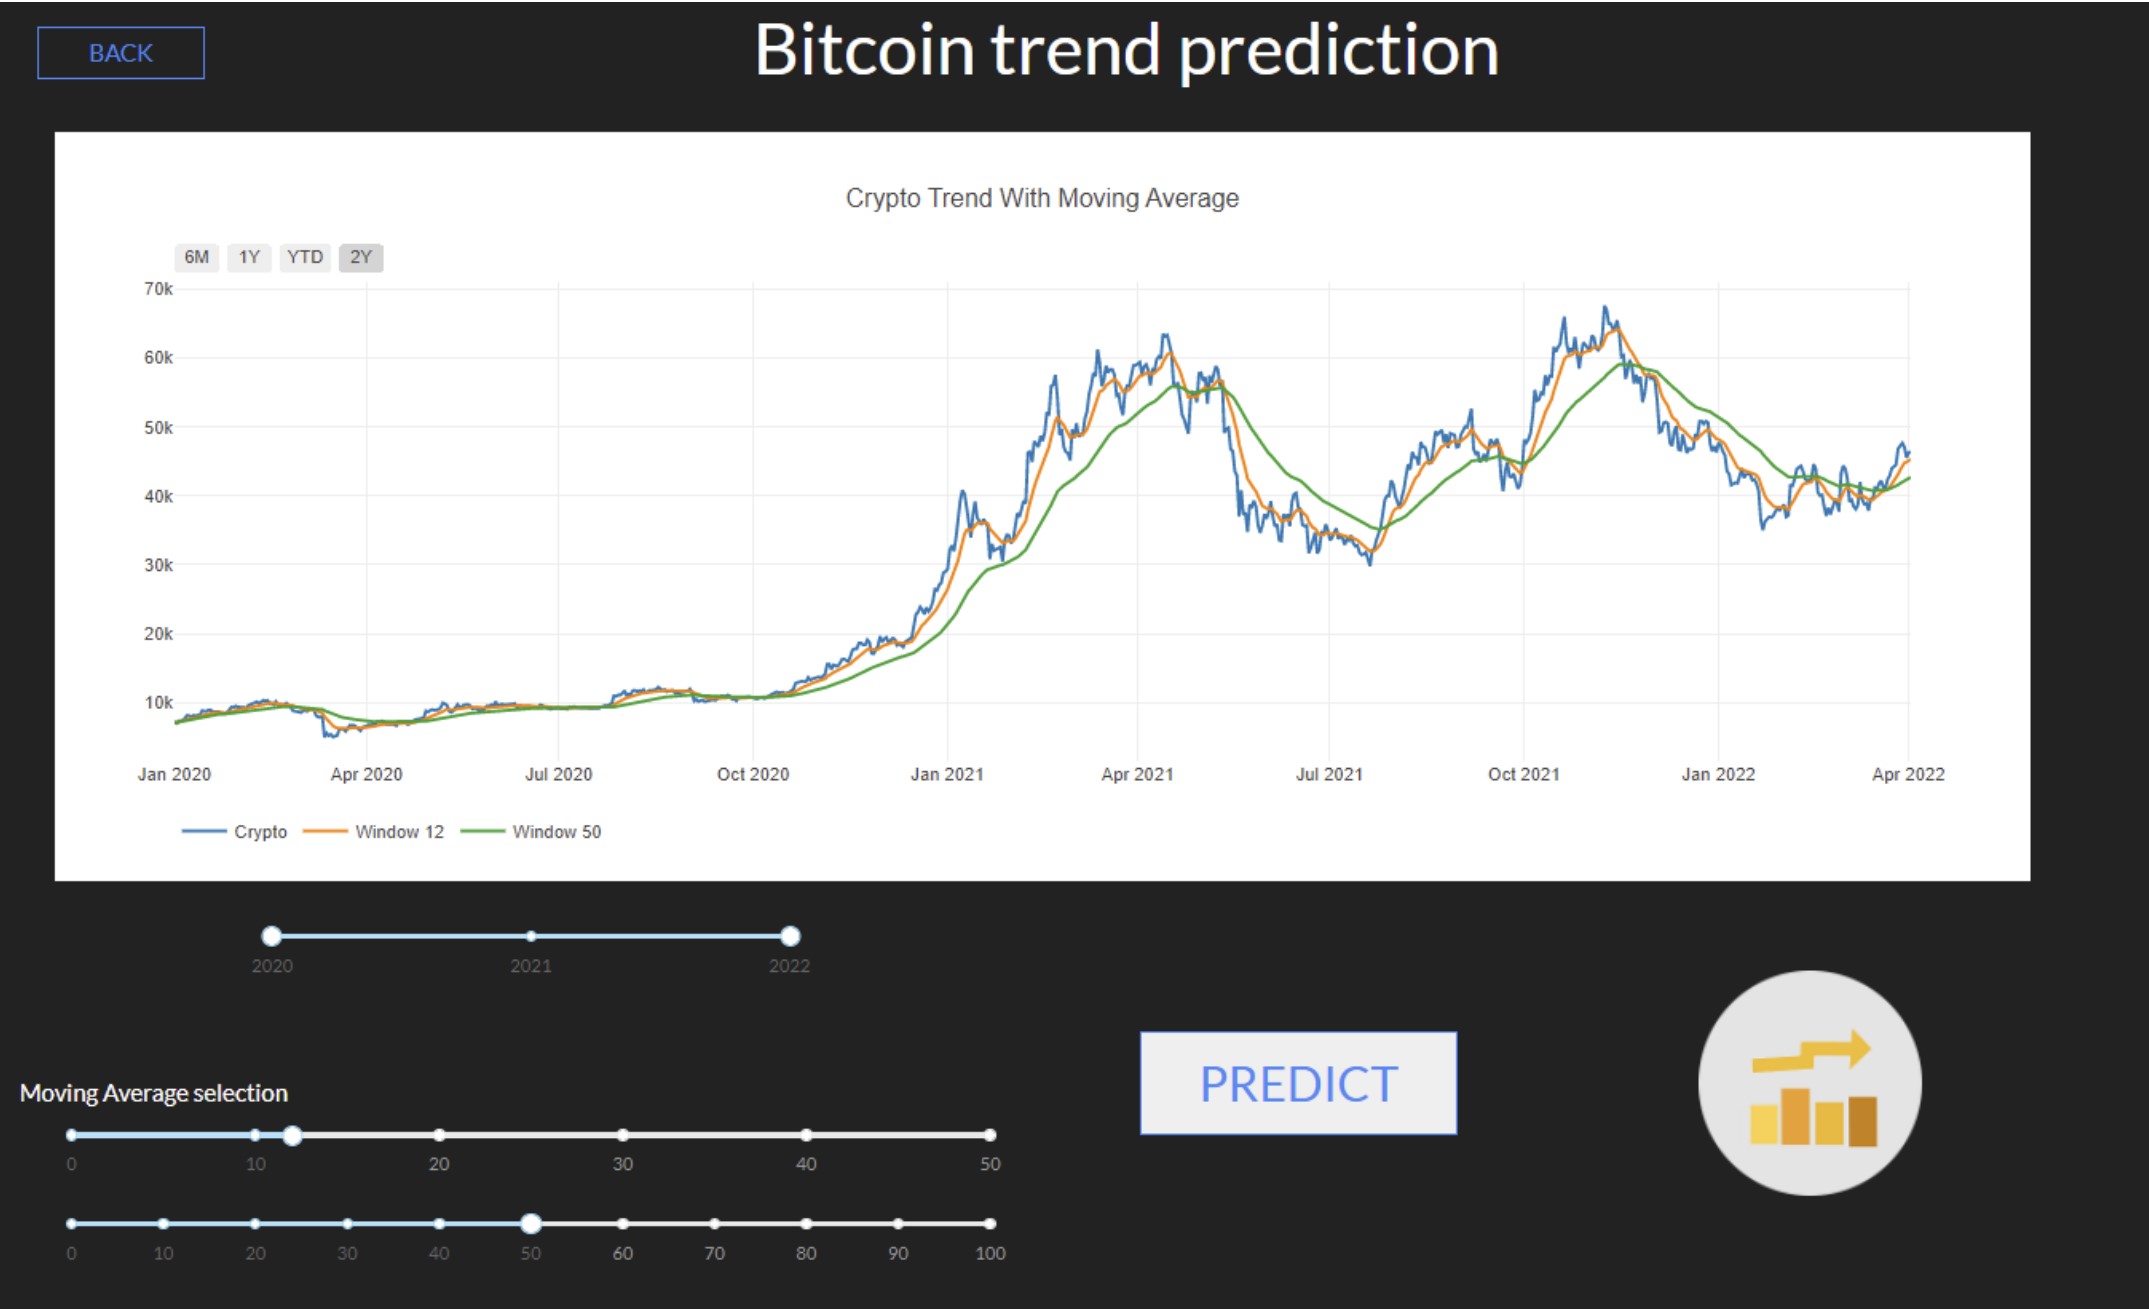
Screenshots 📸
Here is a screenshot illustrating the web app interface: